- Despite the rebound in oil and gas prices during 2021, the performance drag of lower weightings to oil and gas stocks on flagship MSCI ACWI ESG Indexes was marginal.
- Industries had a limited impact on the performance of MSCI ESG Indexes.
- The highest contribution to active returns for MSCI ESG Indexes in 2021 was from stock-specific returns.
In 2021, oil and gas stocks bounced back after five years of weak performance. However, leading MSCI ESG Indexes, which often have lower weights to high-carbon emission industries such as oil and gas, were resilient last year, outperforming the parent MSCI ACWI Index for the second year in a row, even though market conditions were very different. In this blog post, we look at the contributions that industries, in general, and stock selection made to index performance last year.
MSCI ESG Index performance vs. MSCI ACWI Index
MSCI ACWI and ESG Indexes performance
| MSCI ACWI | MSCI ACWI ESG Screened | MSCI ACWI ESG Universal | MSCI ACWI ESG Leaders | MSCI ACWI ESG Focus | MSCI ACWI SRI | |
| 1 Yr | 19.0 | 19.2 | 20.5 | 21.3 | 18.8 | 24.5 |
| 3 Yr | 21.0 | 21.7 | 22.3 | 21.8 | 22.0 | 25.0 |
| 5 Yr | 15.0 | 15.4 | 15.8 | 15.5 | 15.8 | 18.0 |
Oil & gas was offset by semiconductors, airlines, aerospace and defense
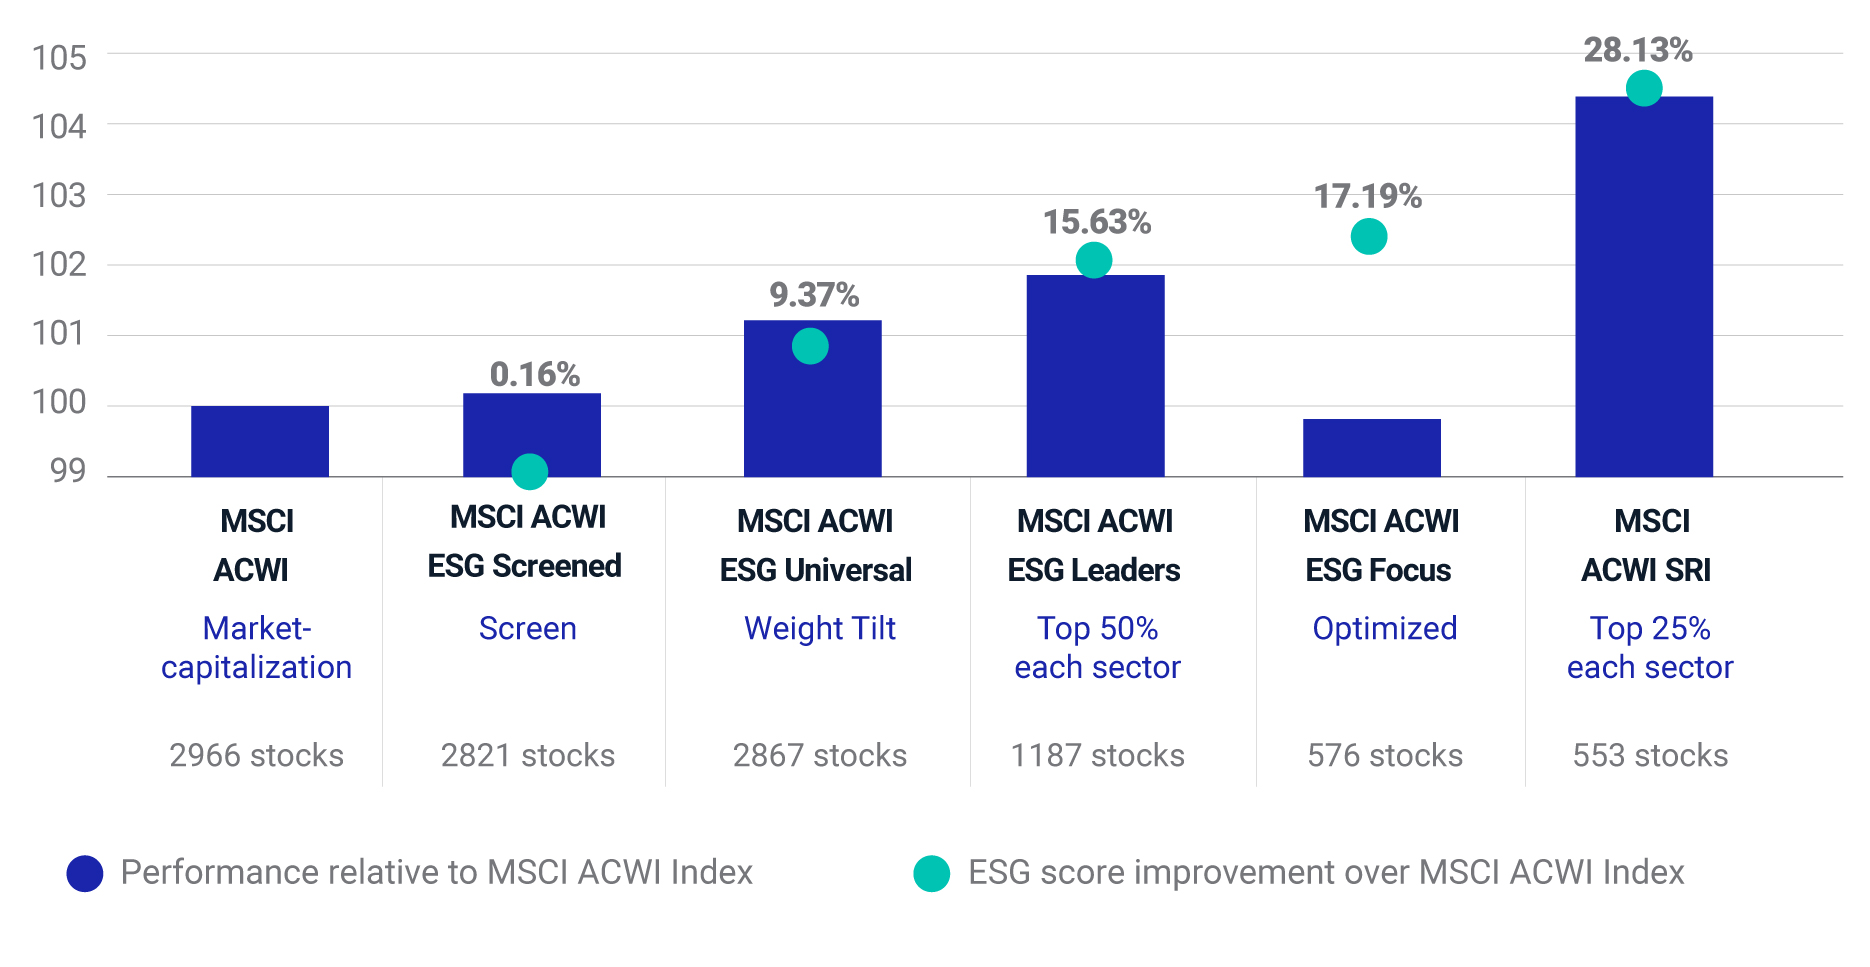
Different MSCI ESG Indexes are designed to meet a variety of investor goals and help to achieve a range of ESG and financial objectives.1
The five ESG indexes in the exhibits above had lower weightings in the oil, gas and consumable fuels2 industry than the parent index — an average of -0.92% in 2021, with the MSCI ACWI SRI Index having the lowest, at -2.41%. MSCI ESG Indexes use a sector-inclusive methodology that selects companies with higher ESG ratings than their industry peers rather than excluding whole sectors.3 This sector-inclusive approach can help mitigate the influence of individual sectors on index returns.4
The weight of the oil, gas and consumable fuels industry in the MSCI ACWI Index equaled 3.4% during 2021. There were no major over- or underexposures of any sectors in the ESG Indexes to the parent index. For example, active sector weights in the ESG Indexes varied from the parent index ranging between -1.08% for communication services to 1.3% for information technology.
To demonstrate how much these lower weightings affected active returns for the MSCI ESG Indexes in 2021, we looked at factor performance attribution using MSCI’s Barra Global Equity Total Market Model with ESG factor (GEM+ESG).5
Last year, the average MSCI ACWI ESG Index’s active return was 1.81%, with only a small average active return for the industry factors of -0.23%. The active return attributed to the oil, gas and consumable fuels industry was small as well, varying between -0.61% and -0.09%.
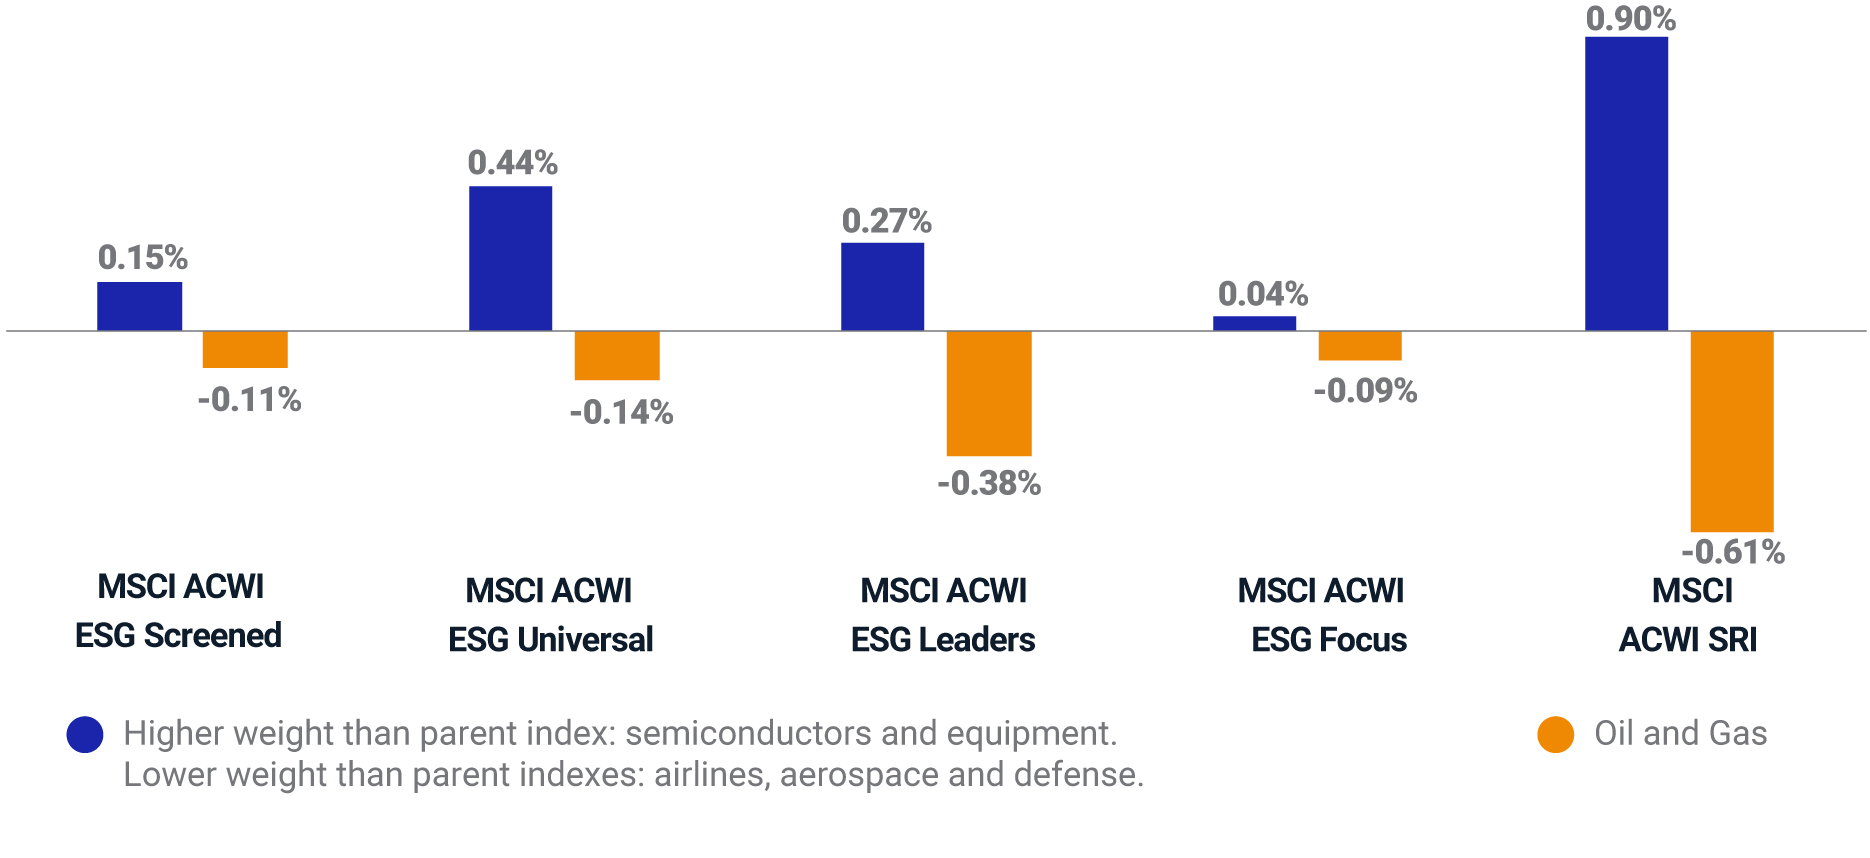
As the leading MSCI ACWI ESG Indexes had higher weights than the parent index in semiconductors, which outperformed, and lower weights in airlines, aerospace and defense, which underperformed, these exposures compensated for almost all the losses from the indexes’ lower exposures to oil, gas and consumable fuels in 2021 (see exhibit below).
Active return contribution from selected GEM+ESG industry factors
Stock selection contributed the most to active returns
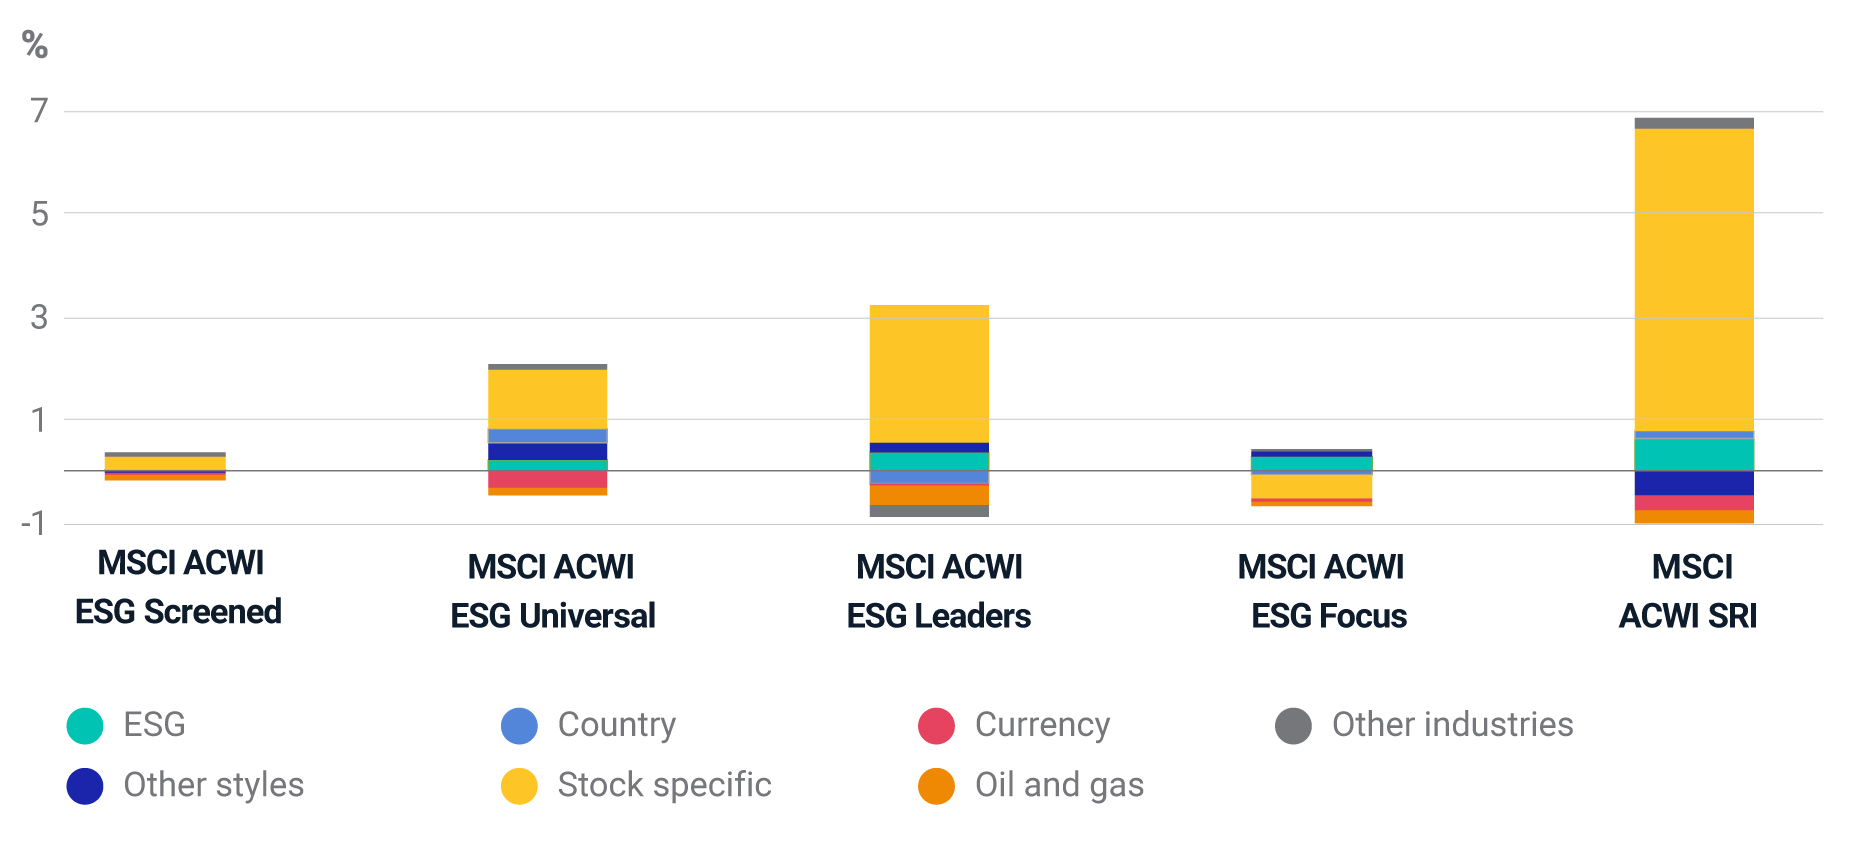
More importantly, the main driver of the MSCI ACWI ESG Index performance in 2021 was stock selection, as we see in the exhibit below. The COVID-19 pandemic caused major changes in everyday life leading to significant changes in consumer demand, supply chains and workforce productivity. Companies that were able to navigate these new trends successfully performed well in 2021.
Factor active-return attribution for MSCI ACWI ESG Indexes
For each of the five indexes, we list the top 10 stocks by their active-specific-return contribution (how much of an asset’s return is not explained by systematic factors) during 2021.
Top 10 active-specific-return contributors for selected ESG Indexes
| MSCI ACWI ESG Screened | MSCI ACWI ESG Universal | MSCI ACWI ESG Leaders | MSCI ACWI ESG Focus | MSCI ACWI SRI |
| MICROSOFT CORP.(AAA) | MICROSOFT CORP. (AAA) | MICROSOFT CORP. (AAA) | ALPHABET INC. (BBB) | MICROSOFT CORP. (AAA) |
| WALMART INC. (BBB*) | NVIDIA CORP. (AAA) | TESLA INC. (A) | MODERNA INC. (BB*) | TESLA INC. (A) |
| TESLA INC. (A) | HOME DEPOT INC. (AA) | ALPHABET INC. (BBB) | MEDTRONIC PLC (BB°) | NVIDIA CORP. (AAA) |
| ALPHABET INC. (BBB) | ALPHABET INC. (BBB) | NVIDIA CORP. (AAA) | BYD CO. LTD. (A) | HOME DEPOT INC. (AA) |
| NVIDIA CORP (AAA) | NETFLIX INC. (BB) | HOME DEPOT. INC (AA) | NUCOR CORP. (BBB) | SHOPIFY INC. (AA*) |
| HOME DEPOT INC. (AA) | NOVO NORDISK A/S (AAA) | THERMO FISHER SCIENTIFIC INC. (BBB) | PELOTON INTERACTIVE INC. (CCC°) | NOVO NORDISK A/S (AAA) |
| PFIZER INC. (B) | SONY GROUP CORP. (AAA) | SHOPIFY INC. (AA*) | HUBSPOT INC. (AA*) | SONY GROUP CORP. (AAA) |
| META PLATFORMS INC. (B) | INTUIT INC. (AA) | NOVO NORDISK A/S (AAA) | NATURGY ENERGY GROUP S.A. (AAA) | CHARLES SCHWAB CORP. (BBB*) |
| UNITEDHEALTH GROUP INC. (BB) | QUALCOMM INC. (BB*) | ACCENTURE PLC (AA*) | CONTEMPORARY AMPEREX TECHNOLOGY CO. LTD. (BBB°) | ASML HOLDING N.V. (AAA) |
| SHOPIFY INC. (AA*) | LOWE’S COMPANIES INC. (AA) | SONY GROUP CORP. (AAA) | SONY GROUP CORP. (AAA) | LOWE’S COMPANIES INC. (AA) |
We explain the methodology of MSCI ESG Ratings in What is an MSCI ESG Rating? If a stock improved its ESG rating since last rating revision, we identify it as positive trend. If the rating has declined, it is a negative trend. See MSCI ESG Investing, Better investments for a better world for more details. Data from Dec. 31, 2020, to Jan. 2, 2022.
Yuliya Plyakha Ferenc, Vice President, MSCI Research